"Data Visualization I" invites you on a journey into the mesmerizing depths of information and imagination. In this stunning artwork, the fusion of art and data unfolds like an enigmatic dreamscape. A harmonious dance of vibrant colours and intricate patterns merges with the precision of data-driven design, creating a visual symphony that challenges your perception.
At first glance, you are drawn into a whirlwind of kaleidoscopic hues, each one representing a unique data point. The vibrant blues, radiant reds, and ethereal greens form a tapestry of visual storytelling that beckons you to decipher its secrets. Lines and shapes, akin to circuitry, intertwine gracefully, weaving a narrative that transcends the binary code.
Yet, as you delve deeper, you realize there is more to "Data Visualization I" than meets the eye. It is a reflection of our world, where data is the connective tissue of our existence. Each stroke of colour, each intricate pattern, carries the pulse of information, the heartbeat of technology, and the rhythm of human experience.
This artwork challenges you to ponder the boundaries between art and science, aesthetics and analytics, and reality and abstraction. It sparks a conversation about the infinite possibilities that lie at the intersection of creativity and data, where imagination breathes life into information.
"Data Visualization I" is an ode to the limitless potential of human ingenuity. It invites you to explore, question, and reimagine the world through the lens of data, reminding us that in the realm of art and information, there are no boundaries, only endless horizons waiting to be discovered.
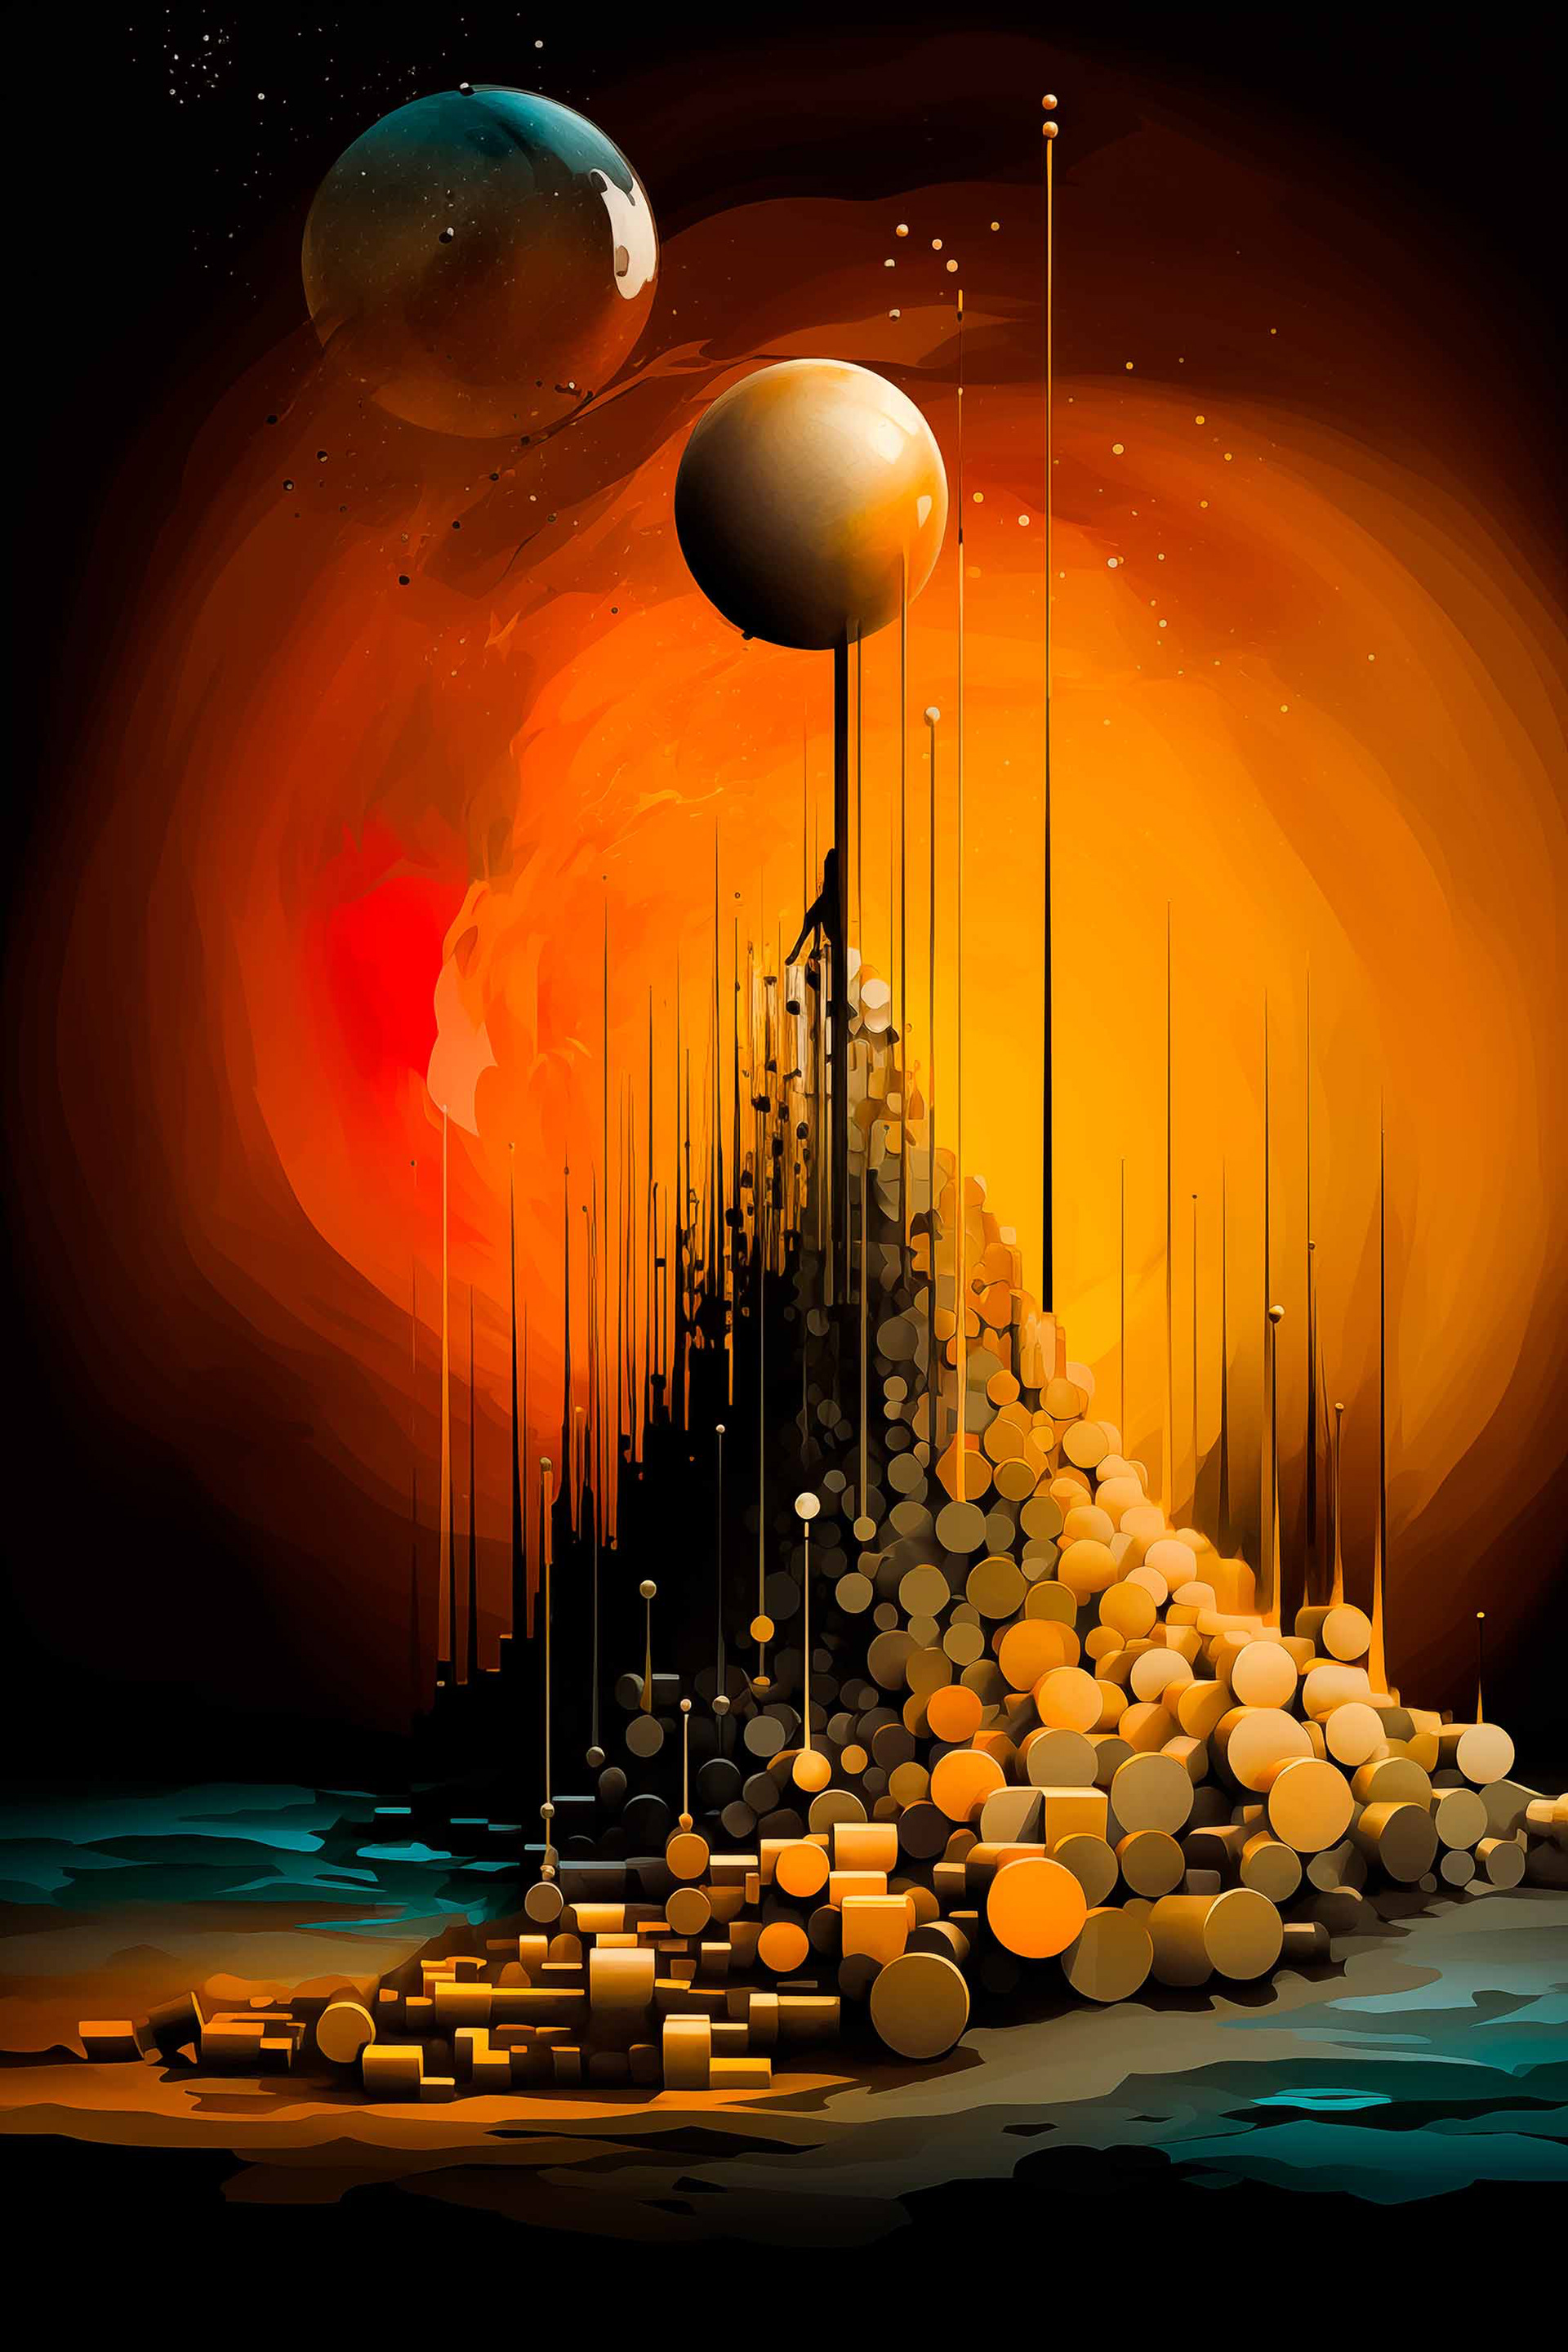
Data Visualization I


