"Data Visualization II", captures the essence of data's fluidity and its transformative journey through space and interpretation.
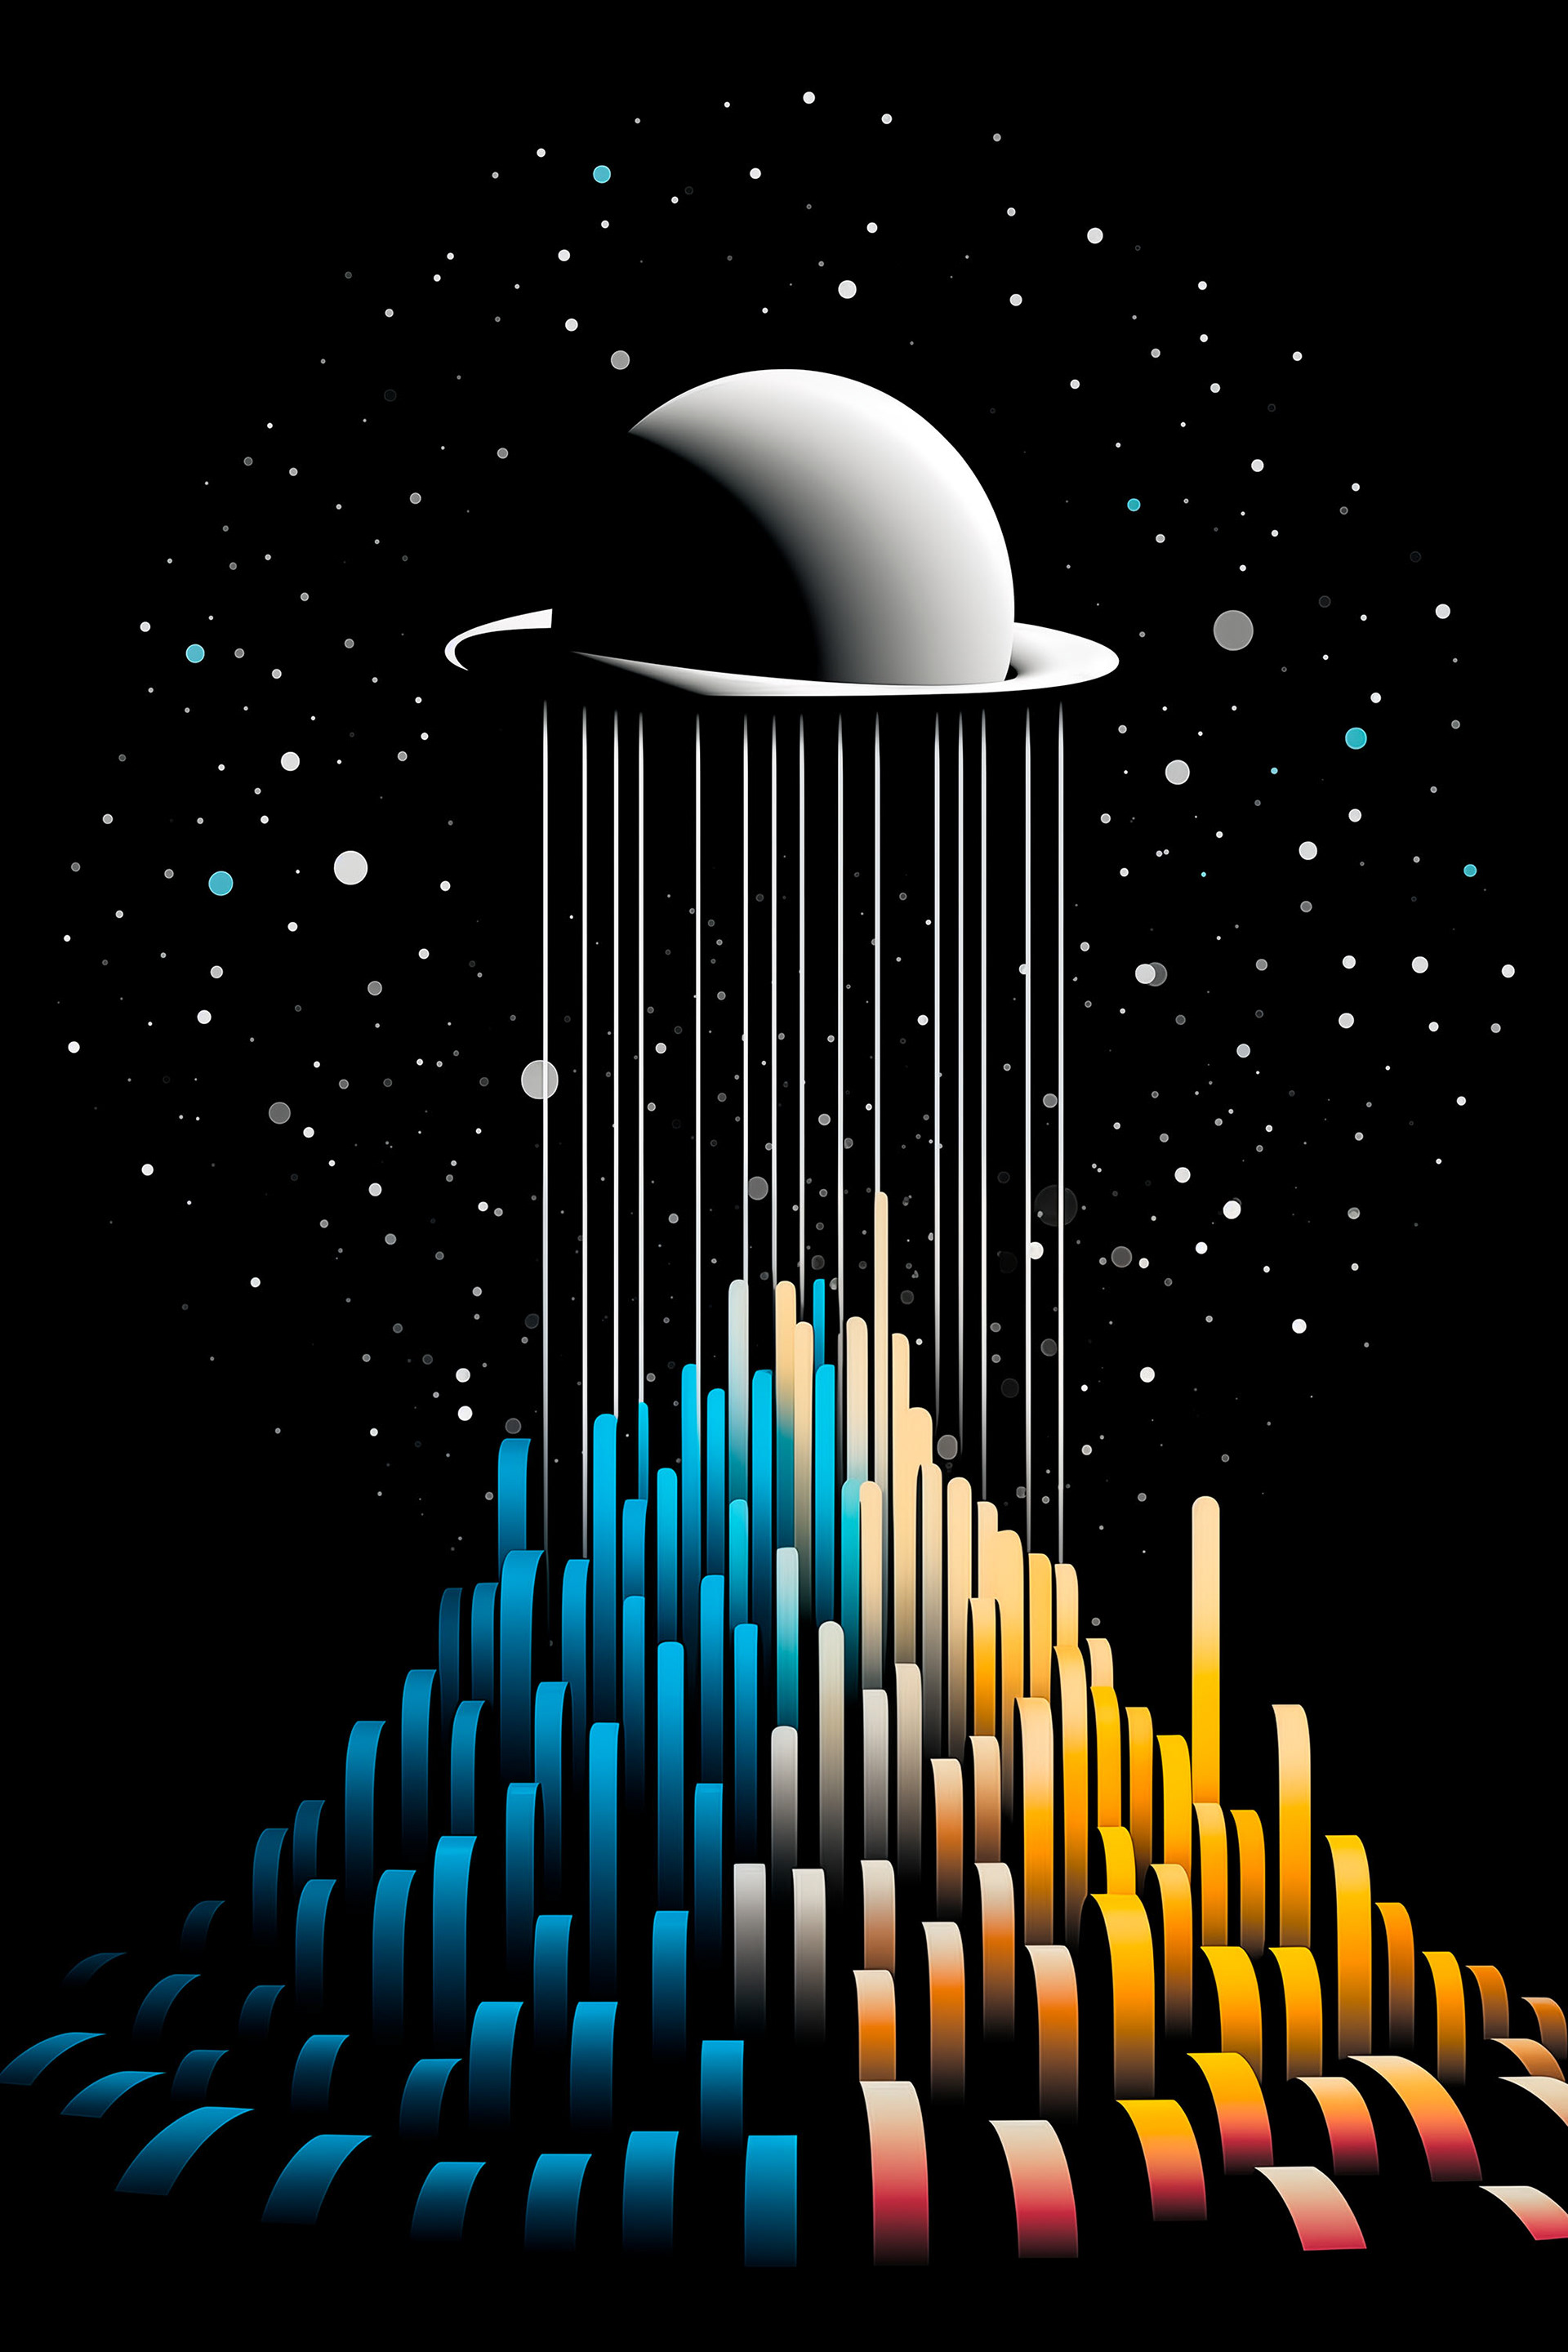
Against a backdrop reminiscent of the deep cosmos, speckled with stars, the central motif presents a spherical form perched atop a cascade of rectangular bars. These bars descend in a pattern that mimics a statistical graph or a digital equalizer, each column's length representative of varying data points.
The use of a monochromatic colour palette for the sphere and bars, with subtle gradients of blues, yellows, and reds, suggests a transition from the abstract to the tangible, symbolizing how raw data can materialize into meaningful insights.
The vertical lines flowing downwards evoke a sense of data being processed, filtered, and ultimately understood, while the celestial background conveys the boundless possibilities that lie in interpreting the unseen patterns of our universe.
Data Visualization II


